Protein Estimation using Bradford Assay
Learn the principle, procedure, and applications of the Bradford assay for protein estimation with tables, FAQs, and step-by-step guide.
PROTOCOLS
Dr. Mainak Mukhopadhyay
9/1/20252 min read
Introduction
Proteins are considered essential biomolecules that perform structural, catalytic, transport, and regulatory functions in living organisms. Accurate estimation of protein concentration is required in biochemical, molecular biology, and biotechnological experiments, including enzyme assays, protein purification, and diagnostic studies.
The Bradford Assay, introduced by M.M. Bradford in 1976, is widely employed as a rapid, sensitive, and convenient colorimetric method for protein estimation. The method is based on the binding of Coomassie Brilliant Blue G-250 dye to proteins under acidic conditions. Upon binding, a shift in absorbance maximum occurs from 465 nm (reddish-brown) to 595 nm (blue). The intensity of the blue color formed is directly proportional to the concentration of protein present in the sample.
This technique is preferred in both teaching and research laboratories because it can be performed quickly, requires small volumes of sample, and is compatible with crude extracts. Results of reasonable accuracy can be obtained without the need for complex instrumentation.
In this experiment, the principle, requirements, detailed procedure, preparation of a standard curve, and interpretation of results are demonstrated to provide a complete understanding of the Bradford Protein Assay.
Principle of Bradford Assay
The Bradford assay works on the interaction of Coomassie Brilliant Blue G-250 dye with proteins under acidic conditions, producing a visible color change.
1. Forms of Coomassie Dye
- Cationic (Red) → λmax ≈ 465 nm
- Neutral (Green)
- Anionic (Blue) → λmax ≈ 595 nm
Without protein, the dye is mostly in the reddish cationic form.
2. Protein-Dye Binding
- Coomassie dye binds non-covalently to proteins.
- Major binding sites: basic amino acids (arginine, lysine, histidine) and aromatic residues (tryptophan, tyrosine, phenylalanine).
- Electrostatic interactions stabilize the blue anionic form.
3. Color Change & Measurement
- Binding shifts the absorbance maximum from 465 nm (red) to 595 nm (blue).
- The intensity of the blue color is directly proportional to protein concentration.
4. Quantification
- Absorbance is measured at 595 nm.
- Protein concentration is determined by comparing against a standard curve.
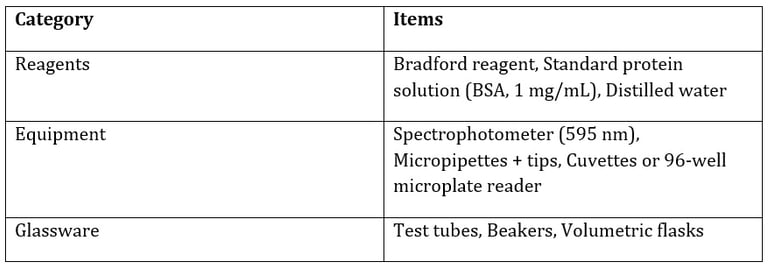
Materials Required


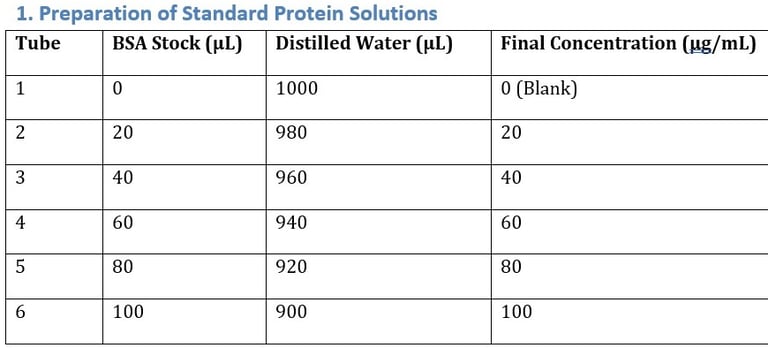
Procedure


2. Reaction Setup
Pipette 100 µL of each standard or unknown sample into labeled tubes/wells.
Add 5 mL Bradford reagent (or 1 mL in microplate format).
Mix gently and incubate for 5–10 minutes at room temperature.
3. Measurement
Measure absorbance at 595 nm.
Use the blank as reference.
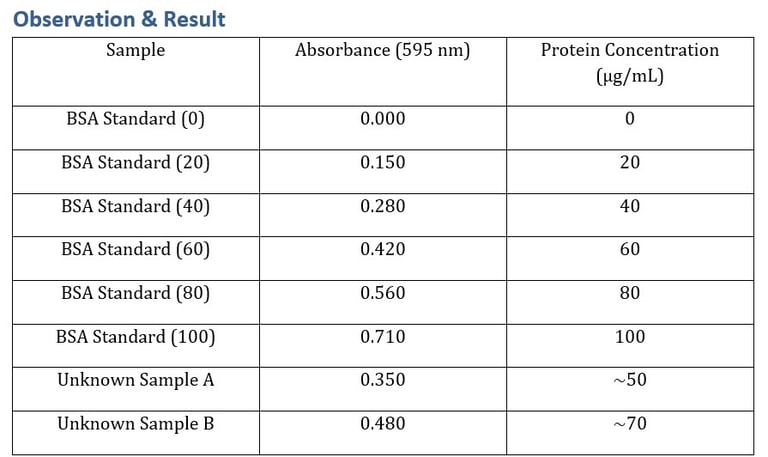
4. Standard Curve
Plot Absorbance vs Protein Concentration.
Use regression equation (y = mx + c) to calculate unknown concentrations.


Precautions
Prepare fresh reagent and protect from light.
Avoid detergents as they interfere with dye binding.
Measure at the same incubation time for all samples.
Perform triplicates for accuracy.
Applications
Estimating protein content in biological samples.
Normalization before SDS-PAGE, Western blot, ELISA.
Protein quantification in molecular biology and clinical labs.
FAQs
Q: Why is BSA used as standard?
A: It is stable, inexpensive, and consistent.
Q: What is the detection range?
A: Typically 1–100 µg/mL.
Q: Why measure at 595 nm?
A: Because the dye-protein complex has maximum absorbance at this wavelength.
Q: Can it be used in microplate format?
A: Yes, widely used in 96-well plates for high-throughput screening.
Conclusion
The Bradford Assay is a fast, sensitive, and reliable method for estimating protein concentration. Its ease of use, cost-effectiveness, and compatibility make it one of the most popular assays in teaching and research laboratories.
Explore
Stay updated with biotech insights and research.
Connect
Discover
m.mukhopadhyay1212@gmail.com
+91-8777294577
© 2025. All rights reserved.